Wednesday, 15 September 2010
Videos
I am aware the videos are now missing., the host has vanished from the web. I will have to record some new ones, that will be fun!
Wednesday, 14 July 2010
10. Risk Reward Ratio
Much misunderstood is risk/reward, yet it can be your perfect ally.
You know by now just how unpredictable the market is, you have learnt that trying to predict what is going to happen next is more difficult than you thought. Your percentage of winning trades is much less than you had hoped for and you are barely making a profit. If you are not practising a good risk reward ratio then this brief article may help you turn a corner.
Just to be clear, a risk reward ratio (RRR) illustrates the relationship between the amount you are risking in your stop with the amount you expect to gain in profit at your target. So if you are aiming for a profit of 40 pips with a 40 pip stop behind your entry then the RRR is 1:1. I look for trades with a RRR of 1:2+ i.e. a profit target at least twice the size of my stop because with this level of RRR, you only need to win 33% of your trades to break even, anything above 33% is profit. Suddenly your % of wins doesn't look so hopeless does it?
Let's look at some numbers to illustrate this: -
Let's look at some numbers to illustrate this: -
Using a 25 pip stop and 50 pip target to give us a RRR of 1:2 over 12 trades.
Winning trades 4 (33%) x 50 pips = 200 pips profit
Losing trades 8 (66%) x 25 pips = 200 pips loss
Break even, simple.
Using a RRR of 1:1 or less (yikes!) means you are depending entirely on your trading edge to grow your account. There are plenty of trades with RRR 1:2+ every day, why take anything less?
To avoid reducing your overall RRR it is also best to avoid the temptation to close trades early, covering the last loser or getting spooked by a retrace are classic examples. If you get into the habit of interfering and exiting because of fear or greed you will be back to 1:1 and below in no time. The only way forward is to make it count over a large number of trades.
Trading multiple lots and taking partials also skews RRR, so if you regularly do this you must ensure that the trade has the appropriate potential.
For example: -
Our trade with a 25 pip stop x 2 lots must now have the potential to travel much further because :-
Risk @ 25 pips x 2 lots = 50
Taking 1 lot partial profit at +25 means the second lot needs to go to +75 to preserve 1:2 RRR.
These are of course simplified figures but hopefully the impact is clear.
Thursday, 18 March 2010
Friday, 12 February 2010
8. Locate Rate and Participate
“When executing trades, plan them out vigorously. Delve into any relevant information you need in order to make an informed decision, and take only the trades which fit into the framework of your profitable trading strategy. Lack of proper planning or learning to take trades based on weak or fundamentally incorrect information, or worse yet, “hunches”, is a quick path to failure. A lot of independent money gets lost due to a lack of proper planning.” – SteveW
Wise words from an experienced trader. As far as I am concerned pretty much everything you need to know to trade support and resistance is in BRV's pdf and on www.nobrainertrades.com.
Looking for confirmation and validation of our s/r levels is just as important as picking the most visually obvious price entry points in the first place. However whether a trade is a winner or a loser, all too often we cannot accurately answer the question, “Why did I take that trade?”
If like me you create a daily plan you will find it easy to incorporate actually rating your upcoming price levels based on other confirming factors into your routine. Recording that rating is critical, whether you have a written plan, an excel spreadsheet or simply add the rating to your charts, recording the probability rating has two major benefits.
Firstly, when price finally arrives at xxxx price (which may be several hours or even days later) you can very quickly see exactly why you were so keen on that level and take the trade without hesitation.
Secondly, rating system records help with post trade analysis and provide a simple way of fine tuning your trading strategy.
My approach is really quite crude and unscientific as the scale has no definitive calibration, but for arguments sake let’s say each confirming condition like a trend line or Fibonacci level is worth 10% (you may want to add greater weight to the more significant factors).
Therefore roughly speaking a trade that has seven confirming factors could be said to have a 70% probability.
As with all the other aspects of trading this is open to interpretation and you should really adapt this principle to what suits you. One thing is certain, the more confirmation we get the higher the probability of market consensus and it is market consensus that we crave for very best reversals and break outs.
These are some examples of what I look for: -
SBR/RBS - Support becomes resistance and vice versa.
TF - The higher the timeframe the more significant the level. This can also help us in our trade management. As trades taken from short term s/r will generally have a shorter run.
00 - Round numbers. We're human we like them. (traders are human too!)
23/38/50/61/78 - Fibonacci. Levels from two different timeframes can double the confirmation.
R -Reaction. How did price behave last time it was here? Wicks at a swing high/low or a strong break out suggest a strong reaction this time too.
S - Space. A nice big arc gives us lots of space and time around our trade.
TL - Trend lines are also s/r so they can be used on both sides just like horizontal s/r.
BB - Bucket bottoms. A favourite of mine, bucket bottoms are a point of very strong former s/r. SBR/RBS is here too.
SB – Spike base. See nobrainertrades.com for an explanation.
HS – Head & Shoulders
QM - Quasimodo
FB – Fractal base
GY – Gartley
and so on, you could add or substitute your favourites.
There we go that's more than 10 conditions so you could say:-
USDCHF 11780-11831
SBR
TF
00
78
R
S
BB
We could call that 70% at least.
One final point, if possible I try to have set ups like this in both directions for the pairs I trade, that way despite my bias I have a bit more of a neutral approach to the market and I am more prepared for unexpected changes in sentiment.
For those that queried what the codes are on my charts - now you know.
As always criticisms and suggestions are welcome.
7. Entry Formula
How many times has price missed your entry by 2 pips? Ever been stopped out by 2 pips and wished you had entered at the back of your zone instead of the front? Here are a few suggestions to help avoid this.
From a level like 16400 I might deduct 5/10 pips for any early turn and then half the spread to give me the mid price as it appears on my charts, so my entries are either:-
16394 which is -5(-0.5xSpread)
or
16389 which is -10(-0.5xSpread)
Which of these I use and whether I take them from the front or back of my trading zone depends on a few more factors:-
Trend trades and bounces off a formerly flat level e.g. bucket bottom or fractal tend to suit the front of a trading zone and the +/-5(+/-0.5xSpread) set up.
Counter trend trades and bounces from levels where price was V shaped are likely to go deeper into a zone so the back of the range would be more appropriate.
Counter trend trades and bounces from levels where price was V shaped are likely to go deeper into a zone so the back of the range would be more appropriate.
Similar to the above, price action and momentum on the final approach is also a good guide as to how deep price may penetrate.
Finally I will generally place an order earlier on levels from a higher timeframe. As I have already said in this blog you will often see price reverse 10-20 pips short of a daily level.
Profitable trading is a result of repeating a successful method over and over, planning your entries is an important part of that.
The distribution of orders means that price will rarely bounce to the pip, but there are a number of variables at work here so I suggest testing these principles out to find out what works for you best.
Wednesday, 20 January 2010
6. Abbreviations
For simplicity I use a lot of abbreviations when I talk about trading conditions: -
- HS - Head + Shoulders
- IHS - Inverted Head + Shoulders
- QM - Quasimodo
- IQM - Inverted Quasimodo
- RS - Right Shoulder
- HL - Horizontal Line
- TL - Trend Line
- TT - Trend Trade
- CT - Counter Trend
- SBR - Support Becomes Resistance
- RBS - Resistance Becomes Support
- TF - Time Frame
- 00 - Round Number
- T+S - Time & Space
- PDH - Previous Daily High
- PDL - Previous Daily Low
- BB - Bucket Bottom
- PB - Pin Bar
- SB - Spike Base
- TW - Tweezers
- RRT - Rail Road Tracks
- S/R - Support & Resistance
- B/E - Break even
- PRT - ProRealTime
- BO - Break out
- FL - Flag
- DT - Double Top
- DB - Double Bottom
- TDA - Top Down Analysis
- TLA - Three Letter Acronym!
Tuesday, 19 January 2010
5. Trading Zones
The easiest way to do this is to use the candle wicks from the last time price was at this level so that the tip of the wick and the candle body become your target zone, if one exists last time price was at the level.
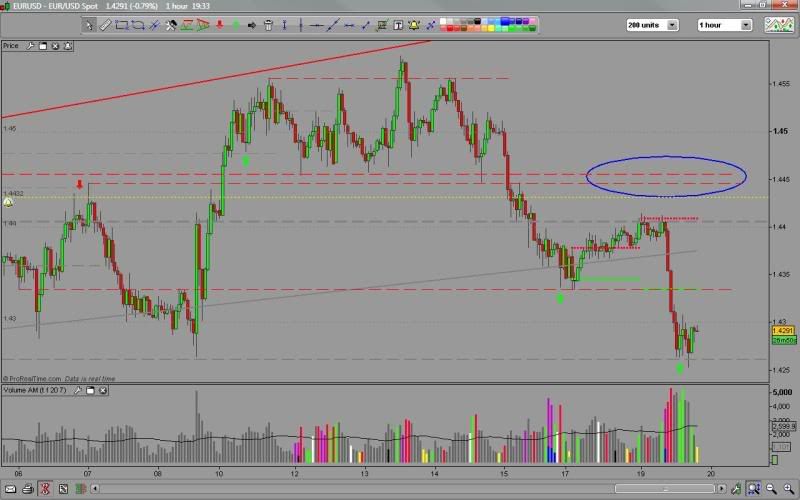
My preferred method results from using the top down analysis described in the last post. I often end up with these ranges defined for me by levels from different time frames by the time I get down to the 1 hour chart.
In the EURUSD chart above, my target area 14446-14455 circled in blue, was defined by the lower, thinner 1 hour s/r level and the upper, thicker 4hour level. An entry any where between these two would have made me happy. Unfortunately a poor news report on top of existing economic pressure made price fall much earlier.
In the EURUSD chart above, my target area 14446-14455 circled in blue, was defined by the lower, thinner 1 hour s/r level and the upper, thicker 4hour level. An entry any where between these two would have made me happy. Unfortunately a poor news report on top of existing economic pressure made price fall much earlier.
Wider ranges defined by multiple levels can be more difficult to deal with, and a concious decision has to be made as to whether an entry is better at the front of the range or the back. There are many theories on this, some say the front of a range is better when entering a trend trade and the back is better for counter trend. Similarly the front may be better if you are using a flat pattern such as a bucket bottom. Momentum and price action needs to be considered as well so I suggest you study this and come up with your own ideal combinations.
The other important point is that I almost always make an adjustment to my entry to take into account the spread and a small price shortfall. So when I say the back of a range it will usually be a few pips away.
Monday, 18 January 2010
4. Identifying Demand and Supply Levels
Top Down Analysis - this is the industry term for what I do, work from the higher time frames downward placing demand and supply levels as I go. By the time I have finished my key TF of 1 hour it should all make sense.
I'm sure you are already actually very proficient at placing your levels but you want to be able to do it better and identify the levels that really matter. Well the main problem is that demand and supply is everywhere and it is easy to cover your charts with lines, unfortunately most of this is just noise that hides what is really going on. Starting with the highest time frames first helps cut down on this noise and allows us to know which TF the level comes from - critical when you are trying to judge an entry or work out how long the reversal might take to complete.
It is often said, the higher the time frame the more significant the level, but also the higher the time frame the wider the influence that level can have. It is possible to get into a trade right at a 1 hour level, but how often does price reverse 15-20 pips away from a daily level? Everything is scaled up, a swing trader using a daily chart aims for hundreds of pips per trade, has a much larger stop than us intraday traders and would think nothing of entering 15-20 pips away from a price level because he/she doesn't want to miss the bus. To reflect this I now use lines of different thickness for each time frame instead of colour coding them to remind me that higher TF levels are more ambiguous.
Here is a short video showing a simplified version of what I typically do to set up my charts for a trading session.
The embedded video has been a problem so if it doesn't work
Subscribe to:
Posts (Atom)