- HS - Head + Shoulders
- IHS - Inverted Head + Shoulders
- QM - Quasimodo
- IQM - Inverted Quasimodo
- RS - Right Shoulder
- HL - Horizontal Line
- TL - Trend Line
- TT - Trend Trade
- CT - Counter Trend
- SBR - Support Becomes Resistance
- RBS - Resistance Becomes Support
- TF - Time Frame
- 00 - Round Number
- T+S - Time & Space
- PDH - Previous Daily High
- PDL - Previous Daily Low
- BB - Bucket Bottom
- PB - Pin Bar
- SB - Spike Base
- TW - Tweezers
- RRT - Rail Road Tracks
- S/R - Support & Resistance
- B/E - Break even
- PRT - ProRealTime
- BO - Break out
- FL - Flag
- DT - Double Top
- DB - Double Bottom
- TDA - Top Down Analysis
- TLA - Three Letter Acronym!
Wednesday, 20 January 2010
6. Abbreviations
For simplicity I use a lot of abbreviations when I talk about trading conditions: -

Tuesday, 19 January 2010
5. Trading Zones
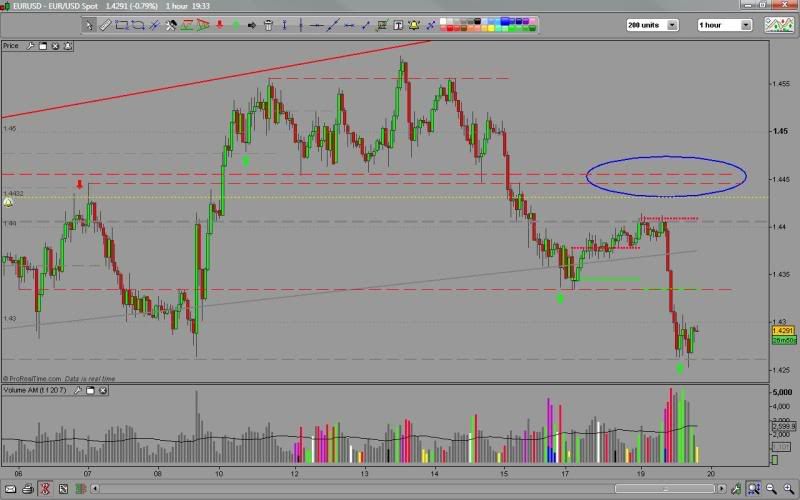
The easiest way to do this is to use the candle wicks from the last time price was at this level so that the tip of the wick and the candle body become your target zone, if one exists last time price was at the level.
My preferred method results from using the top down analysis described in the last post. I often end up with these ranges defined for me by levels from different time frames by the time I get down to the 1 hour chart.
In the EURUSD chart above, my target area 14446-14455 circled in blue, was defined by the lower, thinner 1 hour s/r level and the upper, thicker 4hour level. An entry any where between these two would have made me happy. Unfortunately a poor news report on top of existing economic pressure made price fall much earlier.
In the EURUSD chart above, my target area 14446-14455 circled in blue, was defined by the lower, thinner 1 hour s/r level and the upper, thicker 4hour level. An entry any where between these two would have made me happy. Unfortunately a poor news report on top of existing economic pressure made price fall much earlier.
Wider ranges defined by multiple levels can be more difficult to deal with, and a concious decision has to be made as to whether an entry is better at the front of the range or the back. There are many theories on this, some say the front of a range is better when entering a trend trade and the back is better for counter trend. Similarly the front may be better if you are using a flat pattern such as a bucket bottom. Momentum and price action needs to be considered as well so I suggest you study this and come up with your own ideal combinations.
The other important point is that I almost always make an adjustment to my entry to take into account the spread and a small price shortfall. So when I say the back of a range it will usually be a few pips away.
Monday, 18 January 2010
4. Identifying Demand and Supply Levels
Top Down Analysis - this is the industry term for what I do, work from the higher time frames downward placing demand and supply levels as I go. By the time I have finished my key TF of 1 hour it should all make sense.
I'm sure you are already actually very proficient at placing your levels but you want to be able to do it better and identify the levels that really matter. Well the main problem is that demand and supply is everywhere and it is easy to cover your charts with lines, unfortunately most of this is just noise that hides what is really going on. Starting with the highest time frames first helps cut down on this noise and allows us to know which TF the level comes from - critical when you are trying to judge an entry or work out how long the reversal might take to complete.
It is often said, the higher the time frame the more significant the level, but also the higher the time frame the wider the influence that level can have. It is possible to get into a trade right at a 1 hour level, but how often does price reverse 15-20 pips away from a daily level? Everything is scaled up, a swing trader using a daily chart aims for hundreds of pips per trade, has a much larger stop than us intraday traders and would think nothing of entering 15-20 pips away from a price level because he/she doesn't want to miss the bus. To reflect this I now use lines of different thickness for each time frame instead of colour coding them to remind me that higher TF levels are more ambiguous.
Here is a short video showing a simplified version of what I typically do to set up my charts for a trading session.
The embedded video has been a problem so if it doesn't work
Monday, 7 December 2009
3. Principles of Trading Demand and Supply
These early articles may seem a little obvious and basic to some of you, but something I have noticed is that we often have trouble discussing a subject because we have all started from different points and most of us have gaps in our knowledge. Because of the way that learning resources are recorded and distributed, our journey is often a circular one. Here I am trying to keep things a little more linear.
In the article 'So you want to trade Support and Resistance?' I explained that demand and supply levels are likely trading points because of clusters of orders (or people willing to enter the market) causing an imbalance in demand and supply and rapid movement in price. So having altered our approach to thinking in terms of demand and supply, we need to put that in perspective in terms of order flow in the market. Genuine belief in the principle of demand and supply will be much more useful to you than belief in the more experienced traders who use this method!
There's no point me recording a video about this when Sam Seiden tells it like it is!
The next article will be Identifying Demand and Supply Levels.
Wednesday, 2 December 2009
2. Closes Matter
How many times have you seen a nice solid bullish hourly candle collapse in the last few minutes and leave you with a bearish pin bar (hammer)? The fact is all pin bars or candles with long wicks at some point looked solid and supportive of the trend.
Closes matter.
Although a candle does tell us what is happening while it is active, the final shape is what is really critical. If price collapses then the highs (or lows) were at a level where demand and supply was imbalanced, it is therefore less likely that the trend will continue. So if this happens at one of our predetermined significant demand or supply levels, then we are seeing what we want to see, where we want to see it.
Although a candle does tell us what is happening while it is active, the final shape is what is really critical. If price collapses then the highs (or lows) were at a level where demand and supply was imbalanced, it is therefore less likely that the trend will continue. So if this happens at one of our predetermined significant demand or supply levels, then we are seeing what we want to see, where we want to see it.
This is applicable to all time frames and is the basis upon which most traders operate. I have an alarm set to remind me of all the H4 closes so that I can check to see how we ended up and get a view as to how H4 will affect the other time frames.
The other time closes matter is in conjunction with time frames. It is important to know the correct TF for each demand and supply level, because only then do you know where to look to see if price closes above or below the level.
There will be a section on The Basics of Price Action later on.
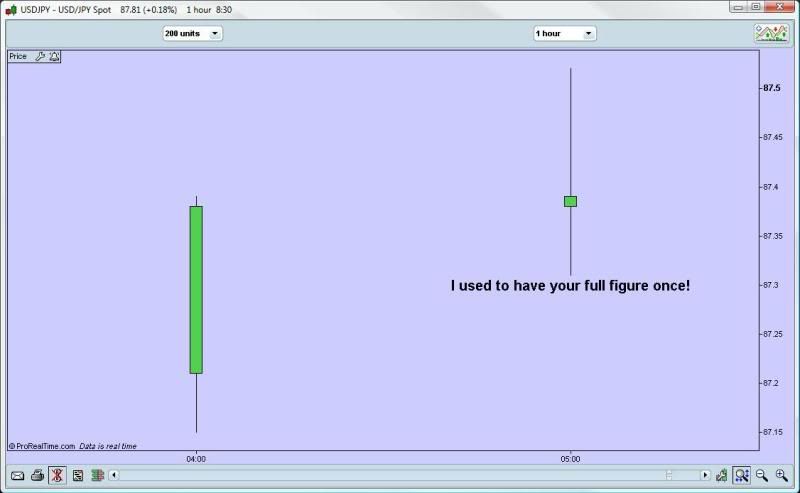
1. So you want to trade Support and Resistance?
To be successful you need to understand what you are working with, the first step is to is to think of it in more appropriate terms.
When you say or hear Support and Resistance, think DEMAND and SUPPLY.
Support is DEMAND (people willing to buy), resistance is SUPPLY (people willing to sell).
It may sound obvious, but thinking in terms of demand and supply will help you understand the trading principle that you are trusting with your money.
To really see the story behind the charts it is easier to first study how demand and supply works with a stock or commodity where there is only one item to be bought or sold unlike a currency pair where there are effectively two.
Why Does Price Move?
In simple terms not everyone is willing to buy and sell at the same price. If we were, our charts would just be horizontal lines!
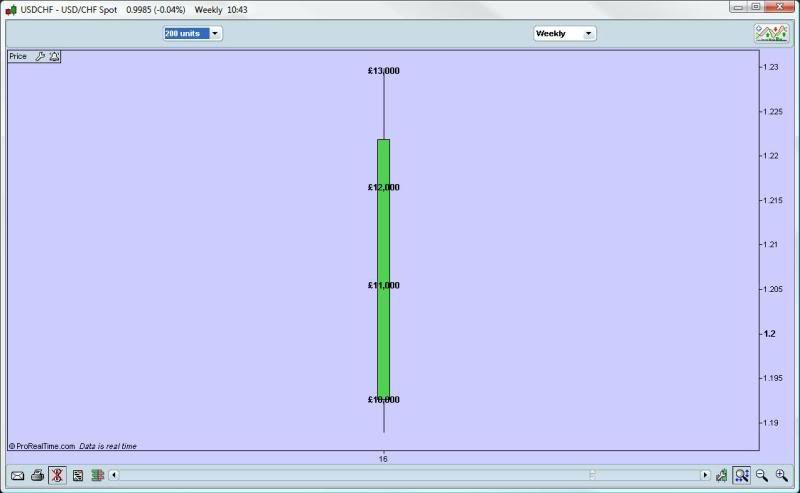
Imagine that you want to buy a sports car. In the weekly classifieds there are six identical examples of the car you want, three are for sale at £10,000, one is £11,000, one £12,000 and one £13,000. Naturally you first phone up after the £10,000 cars first but find that they have all been sold. The number of sellers willing to trade at this price had been exhausted, so the price of this sports car model this week has just gone up to £11,000 because this is the next price at which there is someone willing to sell. You phone up after the £11,000 car and guess what?
Yes, it has also been sold and price goes up again to £12,000. Desperate to have one of these cars before price goes up out of your reach you buy the £12,000 car. To get what you wanted you had to pay more than you had expected to because demand was greater than supply at £10,000 and £11,000, we could assume that the next buyer would have had to pay £13,000 that week.
This example illustrates why price goes up, in a similar way, when there is more supply than demand prices have to fall to find buyers willing to trade.
Why is a Demand or Supply level likely to work?
These are the areas where there are likely to be clusters of orders in the market that will cause an imbalance between demand and supply and therefore a movement in price. The greater the imbalance the faster price could move.
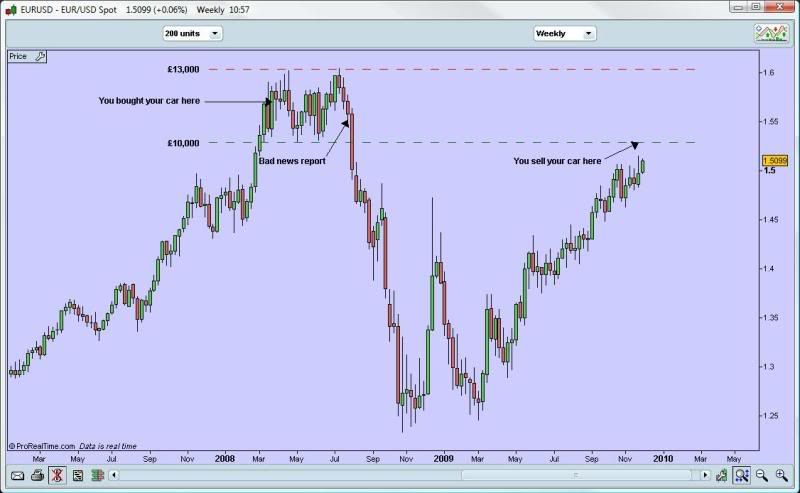
Before you bought your car, prices had been steadily rising for some time. The week following your purchase, prices for this sports car again fluctuated between £10,000 and £13,000 and continued to do so for some time creating a dealing range or consolidation zone. You realise that this isn’t the car for you after all and decide to sell. You look at current prices and realise you can probably get almost all of your money back, but before you can find a buyer a bad report in the press cause prices to tumble to £5,000 before recovering to £8,000 and these figures form the new dealing range for several weeks. Not wanting to sell at a big loss you feel trapped into holding onto your car in the hope that prices recover in the future. Eventually, after the bad news report is forgotten about, prices finally rally back up to £10,000.
Even though this is £2,000 less than you paid and the bottom of the price range where you bought, you grab the opportunity and sell. So do all the others who were also trapped by the impact of the news report and prices tumble from £10,000 once more as the market is swamped with supply.
Everyone who sold from this level traded from the bottom of an inverted bucket, a reliable demand and supply trading set up.
Subscribe to:
Posts (Atom)