To be successful you need to understand what you are working with, the first step is to is to think of it in more appropriate terms.
When you say or hear Support and Resistance, think DEMAND and SUPPLY.
Support is DEMAND (people willing to buy), resistance is SUPPLY (people willing to sell).
It may sound obvious, but thinking in terms of demand and supply will help you understand the trading principle that you are trusting with your money.
To really see the story behind the charts it is easier to first study how demand and supply works with a stock or commodity where there is only one item to be bought or sold unlike a currency pair where there are effectively two.
Why Does Price Move?
In simple terms not everyone is willing to buy and sell at the same price. If we were, our charts would just be horizontal lines!
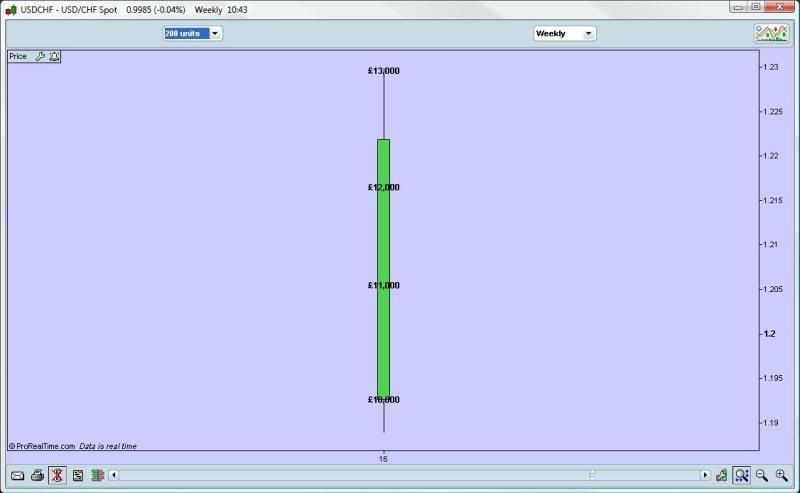
Imagine that you want to buy a sports car. In the weekly classifieds there are six identical examples of the car you want, three are for sale at £10,000, one is £11,000, one £12,000 and one £13,000. Naturally you first phone up after the £10,000 cars first but find that they have all been sold. The number of sellers willing to trade at this price had been exhausted, so the price of this sports car model this week has just gone up to £11,000 because this is the next price at which there is someone willing to sell. You phone up after the £11,000 car and guess what?
Yes, it has also been sold and price goes up again to £12,000. Desperate to have one of these cars before price goes up out of your reach you buy the £12,000 car. To get what you wanted you had to pay more than you had expected to because demand was greater than supply at £10,000 and £11,000, we could assume that the next buyer would have had to pay £13,000 that week.
This example illustrates why price goes up, in a similar way, when there is more supply than demand prices have to fall to find buyers willing to trade.
Why is a Demand or Supply level likely to work?
These are the areas where there are likely to be clusters of orders in the market that will cause an imbalance between demand and supply and therefore a movement in price. The greater the imbalance the faster price could move.
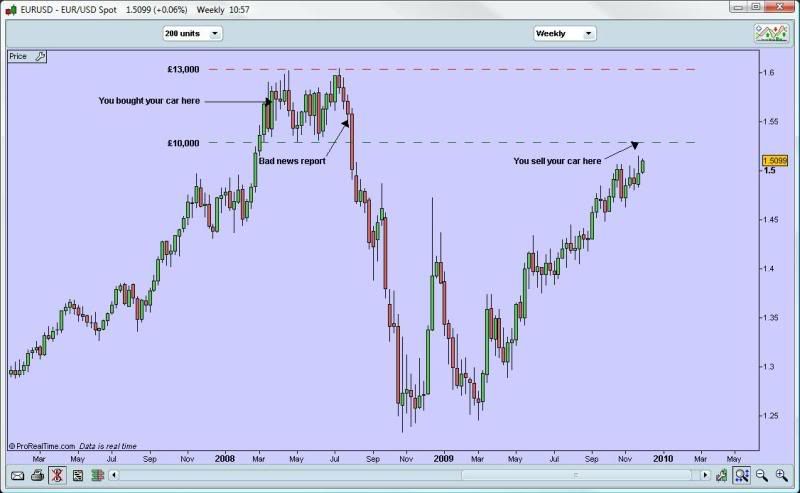
Before you bought your car, prices had been steadily rising for some time. The week following your purchase, prices for this sports car again fluctuated between £10,000 and £13,000 and continued to do so for some time creating a dealing range or consolidation zone. You realise that this isn’t the car for you after all and decide to sell. You look at current prices and realise you can probably get almost all of your money back, but before you can find a buyer a bad report in the press cause prices to tumble to £5,000 before recovering to £8,000 and these figures form the new dealing range for several weeks. Not wanting to sell at a big loss you feel trapped into holding onto your car in the hope that prices recover in the future. Eventually, after the bad news report is forgotten about, prices finally rally back up to £10,000.
Even though this is £2,000 less than you paid and the bottom of the price range where you bought, you grab the opportunity and sell. So do all the others who were also trapped by the impact of the news report and prices tumble from £10,000 once more as the market is swamped with supply.
Everyone who sold from this level traded from the bottom of an inverted bucket, a reliable demand and supply trading set up.
What I find interesting is that it's not only the big sellers that bring prices down from the top - where you sell your car - but also previous sellers that have been trapped in negative territory and now hope to get out at BE or even a bit worse.
ReplyDeleteGenevieve